Gelectric

Vessel monitoring from ship to shore

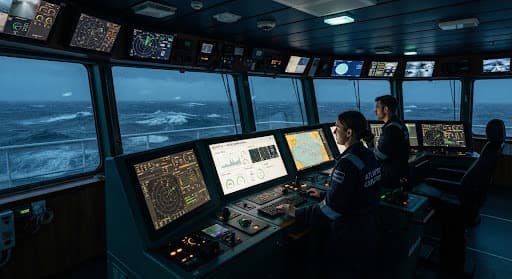
Connect onboard machinery and sensor data in one operational workspace. Follow trends, review configured limits, and give crew and shore teams a shared view of vessel performance.

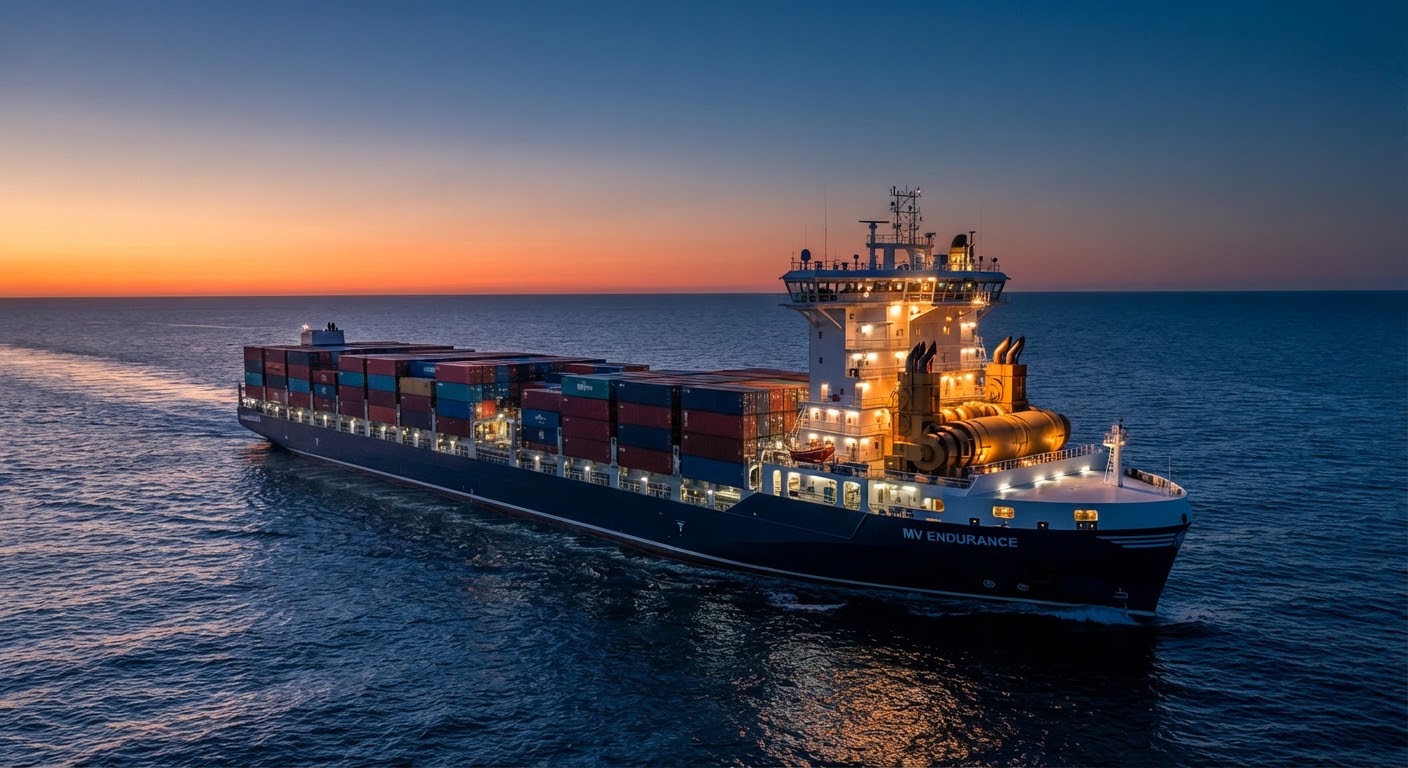
Container vessel at sea at dusk

M/V ACME VESSEL

MAN B&W 7G80ME-C9.5Active ingestion ready
Illustrative vessel view

Onboard data

Engine & bridge feeds

Connected machinery signals

Operating limits

Threshold tracking

Changes that need attention

Trend analysis

Operating comparisons

Readings in their context

Shore connectivity

A shared fleet view

Information for ship and shore

Available measurements and update frequency depend on the connected equipment, onboard setup, and communications.

Operational capabilities

Built for the practical demands of marine engineering.

Bring machinery data into the conversations and decisions your team handles every day, from understanding an unusual reading to planning a follow-up inspection.

Connect onboard systems

Bring available data from machinery, onboard sensors, and existing systems into a shared monitoring workspace. Build the setup around the equipment your team needs to understand.

  • Multiple data sources
  • Equipment-level visibility

Monitor trends & thresholds

Review readings over time alongside configured operating limits. Use the available load and operational context to understand which changes deserve a closer look.

  • Configured operating limits
  • Historical trend comparisons

Support troubleshooting

Give crew and technical superintendents a common view of machinery behavior. Explore related measurements to support an investigation and plan the next check onboard.

  • Related measurements in context
  • A shared basis for investigation

Telemetry workflow

From shipboard measurements to shore decisions.

A connected workflow that turns available vessel readings into information your technical team can put to work.

  1. Phase 01

    Acquire

    Collect the readings available from your onboard instrumentation and connected equipment.

    • Temperatures & pressures
    • Power, speed & operating loads
  2. Phase 02

    Prepare & connect

    Organize data sources, units, and reporting intervals around your monitoring setup and communications.

    • Source and signal mapping
    • Ship-to-shore data transfer
  3. Phase 03

    Monitor & analyze

    Review trends and configured limits to identify changes that need attention from the technical team.

    • Historical operating trends
    • Readings against limits
  4. Phase 04

    Decide & follow up

    Use the operating picture to guide onboard checks, maintenance discussions, and efficiency investigations.

    • Crew and shore collaboration
    • Informed maintenance planning

Explore vessel data through natural language.

Connect relevant monitoring data to Chat with Your Vessel. Ask about readings and operating periods, then bring machinery manuals and maintenance history into the same conversation.

A question about connected readings

Did Auxiliary Engine #3 lube oil pressure change during cargo operations?

AE #3 · Lube oil pressure

In this example, pressure fell to 3.8 bar for 48 seconds before returning to the 4.2–4.5 bar operating range. The connected temperature readings show no corresponding rise.

Explore a conversation
Illustrative conversation using sample telemetry.

Build monitoring around your operation.

Tell us which vessels, equipment, and measurements matter to your team. We’ll discuss the connections and monitoring setup that fit.

Cookie preferences

We use strictly necessary storage for site operation and optional categories for experience, measurement, and marketing. Choose what Gelectric can use, and update it any time from Cookie Settings in the footer.